Guide: Populating vMix graphics with rundown data
• John Barker
Let’s explore using the Public API for Rundown Studio and how you can pull show-critical data from your rundown right into you production switcher.
In this guide we will walk you through setting up the API, pulling data out of a rundown and populating a graphic in vMix.
The plan
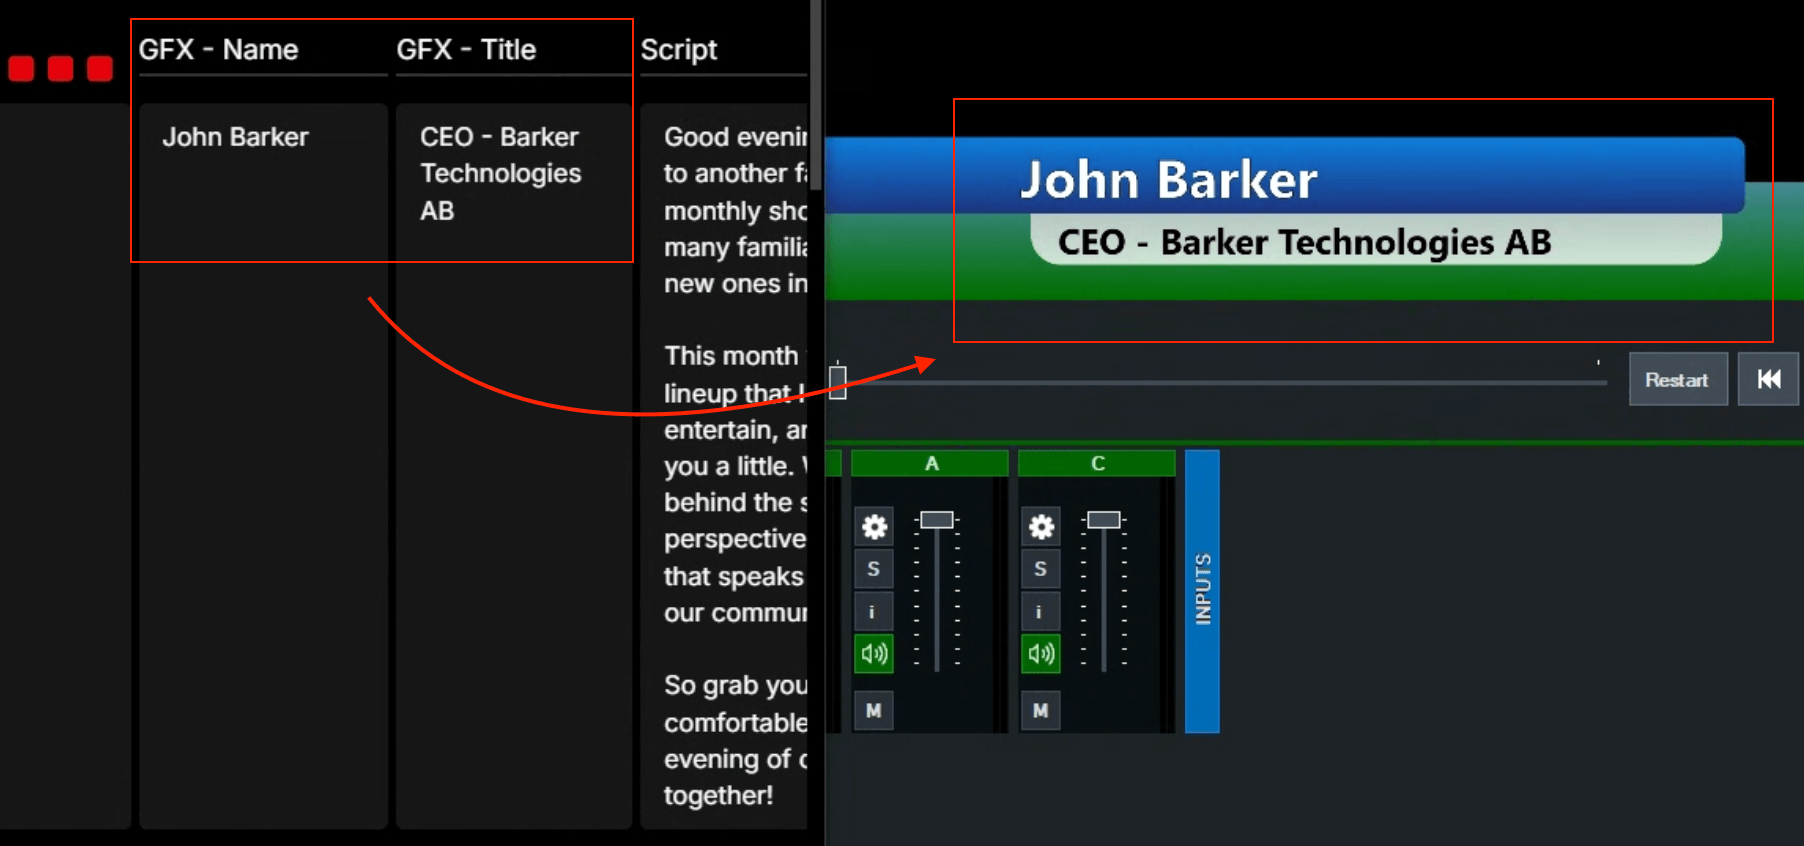
Our end goal is to use a few Graphics columns in Rundown Studio to populate a lower third in vMix. This is a classic use case for data-driven graphic overlays.
Pulling live data from a known good source is always important:
- Graphics operators don’t need to double-check spelling - The data is pulled from a known source.
- Names and Titles are always up to date - Last minute changes to the rundown can be pulled in right away.
Tools and links
Here’s a list of help resources that we will point to throughout this guide:
- Rundown Studio’s Public API: We’ll use this to pull data from our rundown and into the software switcher.
- vMix: Our software of choice for live streaming and adding graphics to our broadcasts.
- vMix Data Source Documentation: Explore more about how Data Sources work in vMix.
Rundown setup
We’ll use the export-csv endpoint from the Public API documentation.
After following the URL breakdown section of our documentation, we have the follow URL ready to use in vMix:
https://app.rundownstudio.app/api-v0/rundown/<rundown_id>/export-csv?token=ABCD1234
// This will return a full CSV version of my rundown to any external service requesting it.
Over to vMix
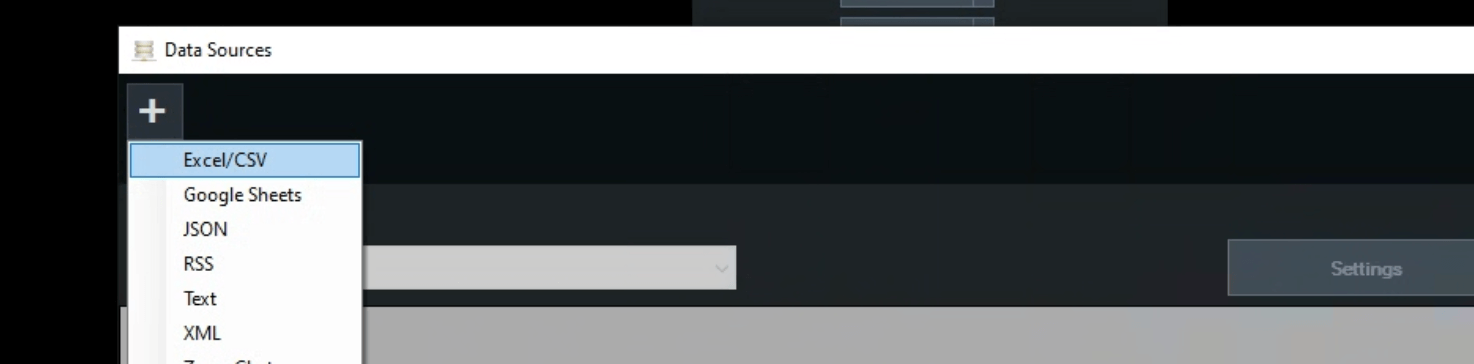
In vMix, it’s time to and a new Data Source. We will use the Excel/CSV option. This will allow us to poll the rundown API and get new data when the rundown is updated.
Next, we can configure the Data Source to use our API link. We can paste the link created earlier in this post into the vMix window.
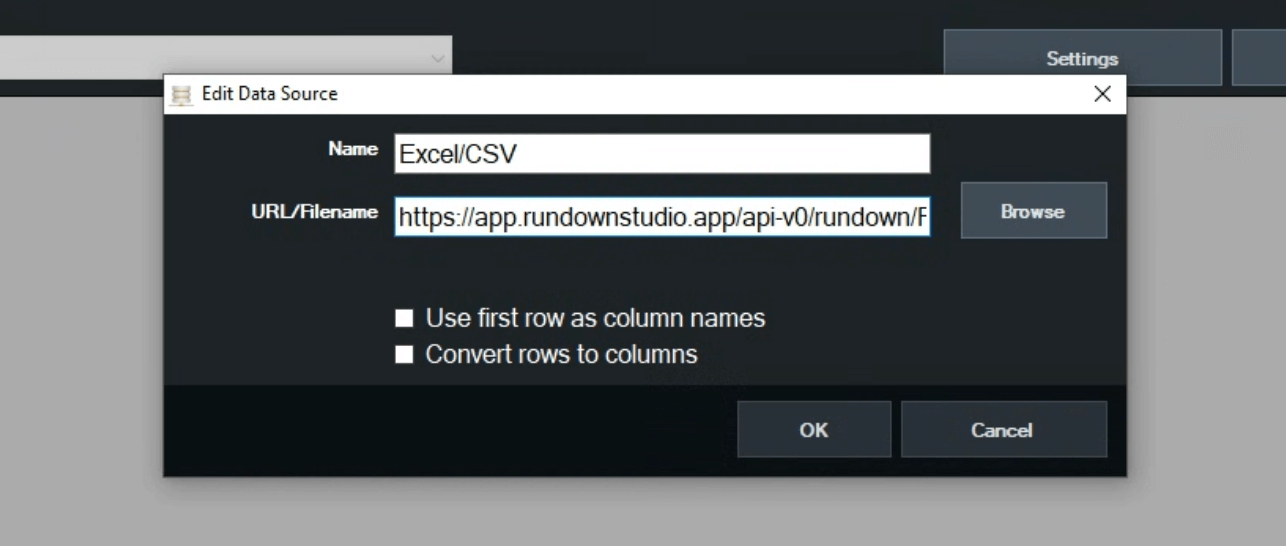
After clicking “okay” we go to the next step - and after waiting a few seconds - vMix will request the data and it will get pulled into the Data Source table.

Populating a title graphic
The final piece in the puzzle is using the data within a title graphic. That’s as easy as adding a title in vMix and pointing it at a Data Source.
With a few dropdown options set, the correct data is now mapped to the title. Any changes in the rundown will also automatically update the title when vMix polls for a new CSV version of the rundown.
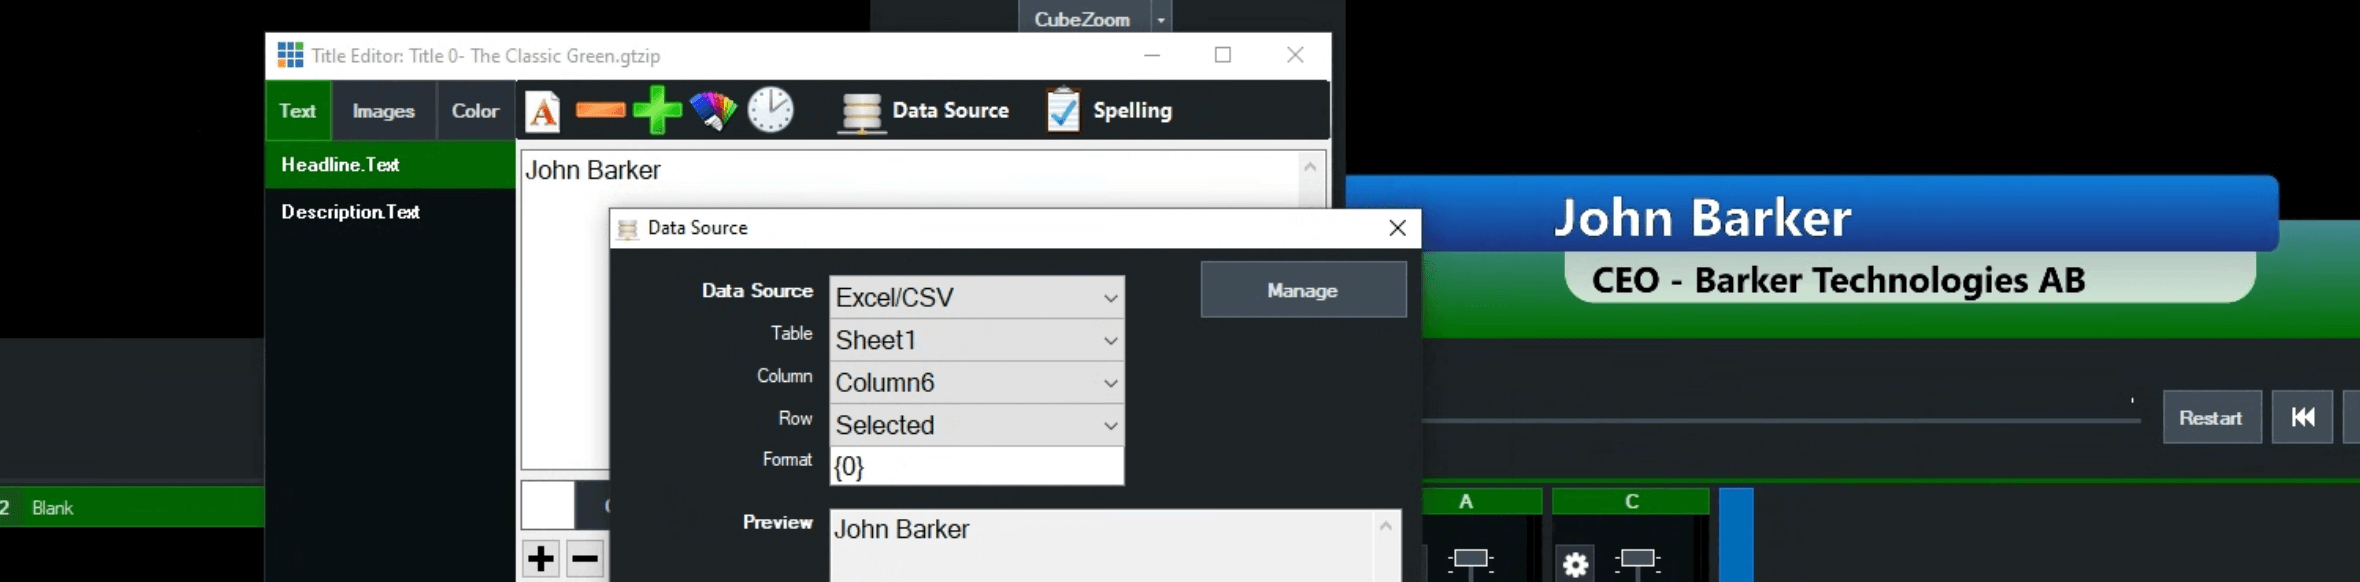
Using the Row: Selected choice allows you to specifically choose a row in the vMix Data Source to populate the graphic.
We did it 🙌
With that, all the pieces are in place for live data to populate our graphics in vMix. From here we can:
- Add more columns to Rundown Studio and use that data in vMix.
- Use the other API request endpoints to pull in more time-accurate information.
- Add images to cells and use those in your graphics